HPAP107 scRNA-seq and CODEX Integration (with cell type annotations)
Overview
This tutorial demonstrates how to integrate HPAP107 scRNA-seq and CODEX datasets from human pancreas using CelLink when cell-type annotations are available.
Outline
Data input
Data preprocessing
Cellink object construction and alignment
Feature imputation and cell-type matching
Visualization
[ ]:
import numpy as np
import pandas as pd
from scipy.io import mmread

import matplotlib.pyplot as plt
plt.rcParams["figure.figsize"] = (6, 4)

from sklearn.metrics import confusion_matrix, ConfusionMatrixDisplay

import anndata as ad
import scanpy as sc

from sklearn.utils.extmath import randomized_svd
from scipy.sparse.linalg import svds
from matplotlib.ticker import MaxNLocator
from matplotlib.lines import Line2D
from sklearn.metrics.pairwise import cosine_similarity
import umap

import seaborn as sns

from cellink import Cellink

import requests
import os
import zipfile
DATA input
Download or point to preprocessed AnnData files. The example cells below download the HPAP107 archive and load four AnnData objects: full scRNA, filtered CODEX, and the two shared-feature objects used for alignment.
If using your own data, ensure each AnnData contains .X, .obs with a cell_type column, and for CODEX .obsm['spatial'] if you want spatial plots.
[2]:
#download HPAP107 data
dropbox_url = "https://www.dropbox.com/scl/fo/pnzya149wk2uq7ak4yvej/ADsoD-Hz0s1BGBrAco-w3lU?rlkey=101pdmutrilndv2j4jxa2n5w9&e=1&st=rxntw6f0&dl=1"
response = requests.get(dropbox_url)
with open("HPAP107_data.zip", "wb") as f:
    f.write(response.content)

print("download success")

extract_dir = "unzipped_HPAP107_data"
os.makedirs(extract_dir, exist_ok=True)

with zipfile.ZipFile("HPAP107_data.zip", 'r') as zip_ref:
    zip_ref.extractall(extract_dir)

print("unzipped data in:", extract_dir)
download success
unzipped data in: unzipped_HPAP107_data
Data preprocessing
This notebook uses the provided cell_type annotations. Verify the column exists in each AnnData (combined_adata, protein_adata_filter, rna_shared, protein_shared) before running the downstream evaluation and matching steps. If cell_type is missing, either add appropriate annotations or follow the “without cell type annotations” tutorial.
[3]:
# Load AnnData objects for the preprocessed datasets and datasets with shared features in two modalities
combined_adata = sc.read_h5ad('unzipped_HPAP107_data/pancreas/combined_adata.h5ad')
protein_adata_filter = sc.read_h5ad('unzipped_HPAP107_data/pancreas/protein_adata_filter.h5ad')
rna_shared = sc.read_h5ad('unzipped_HPAP107_data/pancreas/rna_shared.h5ad')
protein_shared = sc.read_h5ad('unzipped_HPAP107_data/pancreas/protein_shared.h5ad')
/nfs/turbo/umms-drjieliu/usr/zchx/conda_envs/scarches/lib/python3.10/site-packages/anndata/_core/anndata.py:1908: UserWarning: Variable names are not unique. To make them unique, call `.var_names_make_unique`.
  utils.warn_names_duplicates("var")
/nfs/turbo/umms-drjieliu/usr/zchx/conda_envs/scarches/lib/python3.10/site-packages/anndata/_core/anndata.py:1908: UserWarning: Variable names are not unique. To make them unique, call `.var_names_make_unique`.
  utils.warn_names_duplicates("var")
Cellink object construction and alignment
Create a Cellink instance with full and shared AnnData objects, and optionally split data into batches for efficient processing. Below we show the alignment call with recommended parameter guidance.
[4]:
arr = [rna_shared, protein_shared]
cellink = Cellink(full_ann1 = combined_adata, full_ann2 = protein_adata_filter, shared_ann1 = rna_shared, shared_ann2 = protein_shared)
cellink.split_into_batches(arr, 4000, seed = 100)
Cell annotations are provided. Perform Iteratively OT!
The first modality is split into 1 batches, and max batch size is 5141.
The second modality is split into 5 batches, and max batch size is 4000.
Batch to batch correspondence is:
  ['0<->0', '0<->1', '0<->2', '0<->3', '0<->4'].
Alignment key parameters and tuning guidance (with cell-type annotations)
wt1, wt2: Graph smoothing shrinkage weights applied during the graph smoothing step. The smoothing result is computed as: wt * original_features + (1 - wt) * neighborhood_average. These weights control the relative importance of the center cell vs. neighborhood information. Typical values to try: 0.3, 0.5, 0.7, 1. Use lower wt (more smoothing) when data are noisy; use wt=1 to disable smoothing.You can try all of them to figure out which one is best.
n_neighbors (K_Neighbourhood): Number of nearest neighbors used to build the KNN graph. The source code accepts this parameter when constructing graphs. Suggested defaults: 10 (recommended) or 15 for larger datasets. For very small datasets, use 5.
reg: Entropic regularization coefficient used in unbalanced OT Sinkhorn. Controls the smoothness and effective sparsity of the transport matrix. Larger reg lead to smoother (less sparse) transport; smaller reg lead to sharper (more sparse) transport. Default: 0.01. Be cautious when setting drastically different reg values across modalities, as it may bias rows/columns to dominate.
lambd: Entropic regularization coefficient used in balanced OT. It controls the overall transport loss and numerical behaviour. Setting lambd too low can harm convergence and lead to a drop in alignment accuracy. Default 0.01; change gradually and monitor convergence.
sparse: When True, CelLink uses an LBFGS-based solver designed to produce sparser (near one-to-one) correspondences. This often yields crisper matches but is slower and can be numerically less stable on some datasets. When
sparse=False, Sinkhorn-based dense solvers are used.iterative (bool) and numItermax: With
iterative=True, CelLink runs the iterative unbalanced OT refinement stage (Stage II). When cell-type annotations are available, iterative refinement is recommended because the algorithm can leverage annotations to improve matching consistency across cell types.numItermaxcontrols the Sinkhorn/LBFGS maximum iterations — increase it (for example to 1000 or more) if the solver emits convergence warnings.reg_m (tuple): KL-divergence mass regularization coefficients used by unbalanced Sinkhorn; tune when necessary to control mass deviation between modalities.
[5]:
cellink.alignment(wt1 = 0.5, wt2 = 0.5, n_neighbors=10,
                  reg = 0.01, lambd = 0.01, reg_m1 = (20, 0.01), reg_m2 = (0.01, 20), numItermax = 1000, iterative=True, sparse = False)
Now at batch 0<->0...
4618 cells from Modality X are unmatched in Phase I and are realigned in Phase II.
iterative unbalanced optimal transport converges after 5 iterations with cell-type matching accuracy 96.21%!

There are 195 unmatched samples and 4946 matched samples in data1!

3501 cells from Modality Y are unmatched in Phase I and are realigned in Phase II.
iterative unbalanced optimal transport converges after 4 iterations with cell-type matching accuracy 91.35%!

There are 346 unmatched samples and 3654 matched samples in data2!

Now at batch 0<->1...
4623 cells from Modality X are unmatched in Phase I and are realigned in Phase II.
iterative unbalanced optimal transport converges after 5 iterations with cell-type matching accuracy 93.97%!

There are 310 unmatched samples and 4831 matched samples in data1!

3470 cells from Modality Y are unmatched in Phase I and are realigned in Phase II.
iterative unbalanced optimal transport converges after 4 iterations with cell-type matching accuracy 91.25%!

There are 350 unmatched samples and 3650 matched samples in data2!

Now at batch 0<->2...
4648 cells from Modality X are unmatched in Phase I and are realigned in Phase II.
iterative unbalanced optimal transport converges after 5 iterations with cell-type matching accuracy 96.48%!

There are 181 unmatched samples and 4960 matched samples in data1!

3523 cells from Modality Y are unmatched in Phase I and are realigned in Phase II.
iterative unbalanced optimal transport converges after 4 iterations with cell-type matching accuracy 90.95%!

There are 362 unmatched samples and 3638 matched samples in data2!

Now at batch 0<->3...
4620 cells from Modality X are unmatched in Phase I and are realigned in Phase II.
iterative unbalanced optimal transport converges after 5 iterations with cell-type matching accuracy 98.0%!

There are 103 unmatched samples and 5038 matched samples in data1!

3472 cells from Modality Y are unmatched in Phase I and are realigned in Phase II.
iterative unbalanced optimal transport converges after 4 iterations with cell-type matching accuracy 90.86999999999999%!

There are 365 unmatched samples and 3635 matched samples in data2!

Now at batch 0<->4...
4592 cells from Modality X are unmatched in Phase I and are realigned in Phase II.
iterative unbalanced optimal transport converges after 6 iterations with cell-type matching accuracy 95.30999999999999%!

There are 241 unmatched samples and 4900 matched samples in data1!

3465 cells from Modality Y are unmatched in Phase I and are realigned in Phase II.
iterative unbalanced optimal transport converges after 4 iterations with cell-type matching accuracy 91.33%!

There are 347 unmatched samples and 3653 matched samples in data2!
Feature imputation and cell-type matching
After alignment, learned transport maps are used to impute cross-modal features and to predict cell types by aggregating transport mass to annotation classes.
[6]:
rna_source_ct_array = np.zeros(shape = rna_shared.shape[0], dtype = 'object')
rna_predict_ct_array = np.zeros(shape = rna_shared.shape[0], dtype = 'object')
# the cell index of the rna_aligned_protein is not the same as the original cell index, modify the logic by looping cellink.partition1[i] rather than len(rna_batch)
rna_aligned_protein = np.zeros(shape = (combined_adata.shape[0], protein_adata_filter.shape[1]))
for i in range(len(cellink.partition1)):
    cell_id = cellink.partition1[i]
    match_id = np.array(list(cellink.cell_correspondence_partition1[i].keys()))
    jump_num = 0
    for j in range(len(cell_id)):
        rna_source_ct_array[cell_id[j]] = rna_shared.obs['cell_type'].iloc[cell_id[j]]
        unmatched_cell_id_rna = cellink.arr1_unmatched_cell_id[i]
        if j in unmatched_cell_id_rna:
            rna_predict_ct_array[cell_id[j]] = cellink.arr1_wrong_ct[i][np.where(unmatched_cell_id_rna == j)[0][0]]
            jump_num = jump_num + 1
        else:
            rna_predict_ct_array[cell_id[j]] = rna_shared.obs['cell_type'].iloc[cell_id[j]]
            nid = np.where(match_id == j)[0][0]
            rna_aligned_protein[cell_id[j], :] =  cellink.feature_imputation_partition1[i][nid, :]

protein_source_ct_array = np.zeros(shape = protein_shared.shape[0], dtype = 'object')
protein_predict_ct_array = np.zeros(shape = protein_shared.shape[0], dtype = 'object')
protein_aligned_rna = np.zeros(shape = (protein_adata_filter.shape[0], combined_adata.shape[1]))
for i in range(len(cellink.partition2)):
    cell_id = cellink.partition2[i]
    match_id = np.array(list(cellink.cell_correspondence_partition2[i].keys()))
    jump_num = 0
    for j in range(len(cell_id)):
        protein_source_ct_array[cell_id[j]] = protein_shared.obs['cell_type'].iloc[cell_id[j]]
        unmatched_cell_id_protein = cellink.arr2_unmatched_cell_id[i]
        if j in unmatched_cell_id_protein:
            protein_predict_ct_array[cell_id[j]] = cellink.arr2_wrong_ct[i][np.where(unmatched_cell_id_protein == j)[0][0]]
            jump_num += 1
        else:
            protein_predict_ct_array[cell_id[j]] = protein_shared.obs['cell_type'].iloc[cell_id[j]]
            nid = np.where(match_id == j)[0][0]
            protein_aligned_rna[cell_id[j], :] =  cellink.feature_imputation_partition2[i][nid, :]
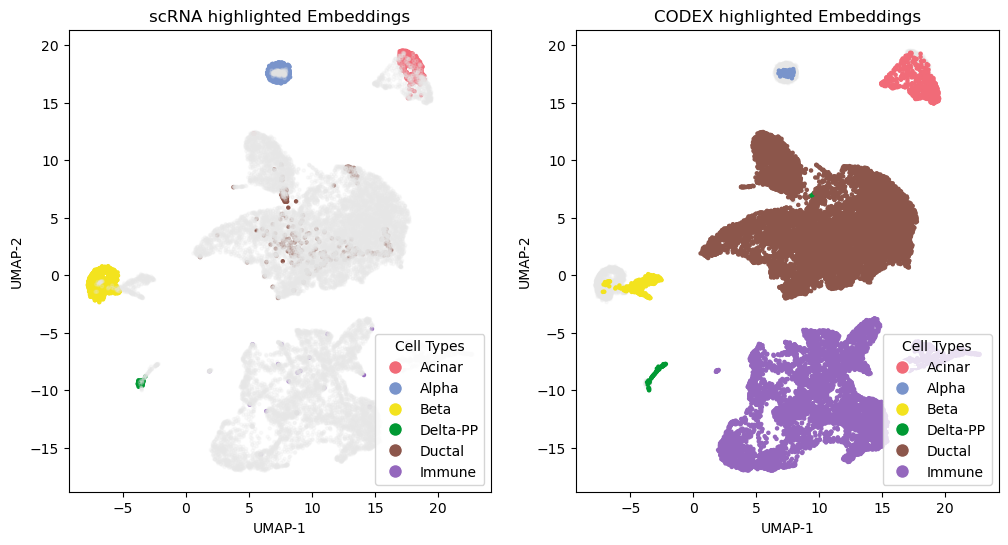
Visualization
Compute UMAPs and produce embedding panels and confusion matrices to evaluate alignment quality and cell-type matching.
[7]:
import umap
matched_rna = rna_source_ct_array == rna_predict_ct_array
matched_protein = protein_source_ct_array == protein_predict_ct_array
dataall_0 = np.concatenate([combined_adata.X, protein_aligned_rna[matched_protein, :]], axis = 0)
embedding_0 = umap.UMAP(n_components=2, n_epochs = 500, n_neighbors = 15, random_state = 30, min_dist = 0.5).fit_transform(dataall_0)
ct_array_double_0 = np.concatenate([rna_source_ct_array, protein_source_ct_array[protein_source_ct_array == protein_predict_ct_array]], axis = 0)

dataall_1 = np.concatenate([protein_adata_filter.X, rna_aligned_protein[matched_rna, :]], axis = 0)
embedding_1 = umap.UMAP(n_components=2, n_epochs = 500, n_neighbors = 15, random_state = 30, min_dist = 0.5).fit_transform(dataall_1)
ct_array_double_1 = np.concatenate([protein_source_ct_array, rna_source_ct_array[rna_source_ct_array == rna_predict_ct_array]], axis = 0)

scrna_all = np.concatenate([combined_adata[matched_rna].X, rna_aligned_protein[matched_rna]], axis = 1)
codex_all = np.concatenate([protein_aligned_rna[matched_protein], protein_adata_filter[matched_protein].X], axis = 1)

dataall_2 = np.concatenate([scrna_all, codex_all], axis = 0)
embedding_2 = umap.UMAP(n_components=2, n_epochs = 500, n_neighbors = 15, random_state = 30, min_dist = 0.5).fit_transform(dataall_2)
ct_array_double_2 = np.concatenate([rna_source_ct_array[matched_rna], protein_source_ct_array[matched_protein]], axis = 0)
[8]:
protein_aligned_rna = protein_aligned_rna[protein_source_ct_array == protein_predict_ct_array, :]
ct_protein_aligned = protein_source_ct_array[protein_source_ct_array == protein_predict_ct_array]
rna_aligned_protein = rna_aligned_protein[rna_source_ct_array == rna_predict_ct_array, :]
ct_rna_aligned = rna_source_ct_array[rna_source_ct_array == rna_predict_ct_array]
[10]:
from matplotlib.lines import Line2D
import matplotlib.pyplot as plt
datatype = ['scRNA', 'CODEX']
ct_array_double = ct_array_double_2
datatype_array_double = np.concatenate([np.repeat(datatype[0], sum(matched_rna)), np.repeat(datatype[1], sum(matched_protein))], axis = 0)
ct_array1 = combined_adata[matched_rna,].obs['cell_type'].values
ct_array2 = protein_adata_filter[matched_protein].obs['cell_type'].values

color_palette = plt.cm.tab10(np.linspace(0, 1, 10))[::-1]
cts = np.unique(ct_array_double)
num_type = len(cts)
if num_type > 10:
    repeats = -(-num_type // 10)
    color_palettes = np.tile(color_palette, (repeats, 1))
    colors = color_palettes[:num_type]
else:
    colors = color_palette[:num_type]
colorbar = {t: colors[i] for i, t in enumerate(cts)}

manual_colors = ['#F26B78', '#7995CC', '#F4E41E']
for i, color in enumerate(manual_colors):
    if i < len(cts):
        colorbar[cts[i]] = np.array([int(color.strip('#')[j:j+2], 16) / 256 for j in (0, 2, 4)] + [1])  # Convert hex to RGB tuple

if len(cts) >= 4:
    colorbar[cts[3]] = (0, 0.6, 0.2, 1.0)

color_points = np.array([colorbar[i] for i in ct_array_double])

dts = np.unique(datatype_array_double)
color_datatype = ["#FFA500", "#004D99"]
colorbardt = {t: color_datatype[i] for i, t in enumerate(dts)}
color_dt = np.array([colorbardt[i] for i in datatype_array_double])

grey = np.array([0.9, 0.9, 0.9, 0.2])[np.newaxis, :]

protein_id = np.array(range(0, len(ct_array1)))
rna_id = np.array(range(len(ct_array1), len(ct_array_double)))
color_points1 = color_points.copy()
color_points1[rna_id, :] = grey
color_points2 = color_points.copy()
color_points2[protein_id, :] = grey

fig, axs = plt.subplots(1, 2, figsize=(12, 6))
axs[0].scatter(embedding_2[:,0], embedding_2[:,1], color=color_points1, s=5.)
axs[1].scatter(embedding_2[:,0], embedding_2[:,1], color=color_points2, s=5.)
axs[0].set_title('scRNA highlighted Embeddings')
axs[1].set_title('CODEX highlighted Embeddings')
axs[0].set_xlabel('UMAP-1')
axs[0].set_ylabel('UMAP-2')
axs[1].set_xlabel('UMAP-1')
axs[1].set_ylabel('UMAP-2')
for i in axs:
    i.set_facecolor('none')
fig.patch.set_facecolor('none')

legend_celltype = [Line2D([0], [0], marker='o', color='w', label=f'{t}',
                              markerfacecolor=c, markersize=10) for t, c in colorbar.items()]
legend_dt = [Line2D([0], [0], marker='o', color='w', label=f'{t}',
                            markerfacecolor=c, markersize=10) for t, c in colorbardt.items()]

axs[0].legend(handles = legend_celltype, title = "Cell Types", loc = "lower right")
#plt.gca().add_artist(legend1)
axs[1].legend(handles = legend_celltype, title = "Cell Types", loc = "lower right")


plt.show()